Income statements don’t cover everything you need to know about your business. But you can use them alongside balance sheets and cash flow statements to create a fuller picture of your financial and business performance.
The ins and outs of income statements
In his book, How to Keep Score in Business, finance and accounting author Robert Follett observed that business owners are often confused about how to keep track of their finances.
He argued that it’s easy to get mixed up with the smaller-picture data like profits, assets, and cash flow rather than take a step back and look at a company’s finances as a whole.
Whether you’re digging into your numbers for the first time or have always analyzed the financial statements your accounting team puts together, there’s no doubt that the more minor aspects of your business’s financial health can be overwhelming to track.
And that’s why your core business activities need income statements: These handy financial documents are essential for business planning and measuring your company’s financial health.
What is an income statement and why is it important?
Whether you generate an income statement monthly, quarterly, or annually, this financial report (also called a profit and loss statement) shows you the revenue, expenses, profits, and losses your business experienced during that period.
Overall, income statements are essential to understanding whether your company is performing well and gives you a glimpse of your company’s profitability.
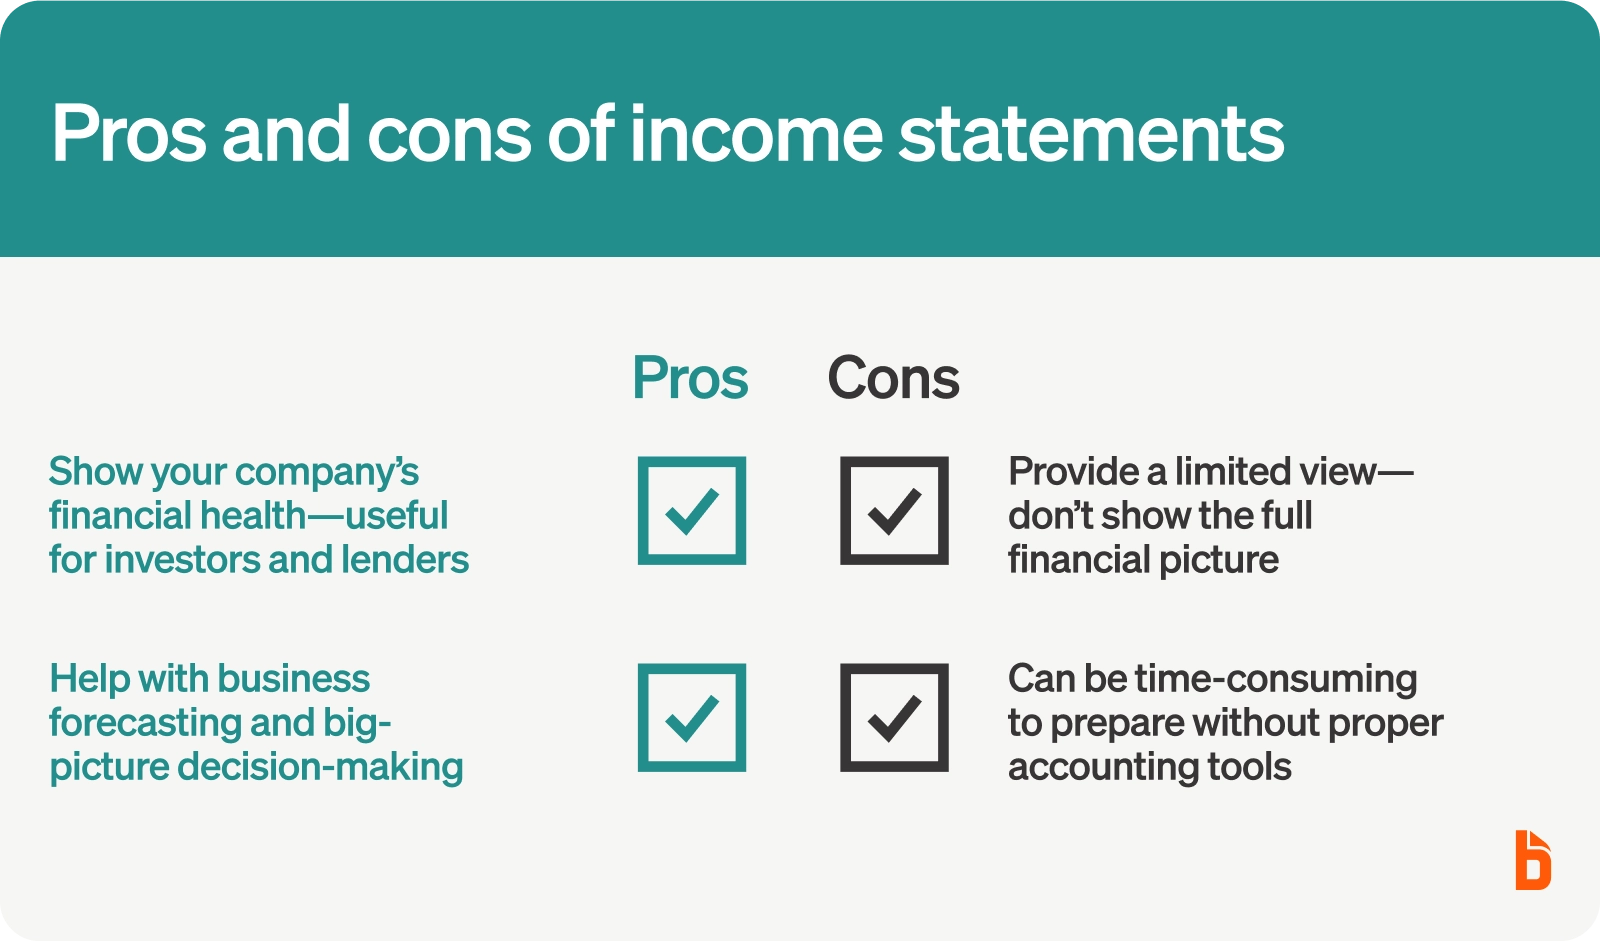
While income statements can’t provide everything you need to know, they can do a lot. Here’s an overview of the pros and cons of income statements:
Advantages of income statements
The most obvious benefit of income statements is that they provide insights into your company’s financial health. That’s why they’re an ideal document to give to investors, lenders, and creditors when you’re looking for business capital.
Additionally, income statements are useful for forecasting. Business forecasting is the process of looking for insights and making predictions based on current and past information, which is helpful when making big-picture decisions like creating budgets or setting future goals.
Drawbacks of income statements
Income statements don’t cover the whole picture; they’re simply a surface-level explanation of your business’s financial data. So, looking at them alone, you could miss important information that might appear in other financial statements.
It’s also worth noting that income statements are time-consuming to create without accounting software or an expense management system that pulls transactions from your bank and credit card accounts and automatically classifies transactions for you.
The four essential aspects of an income statement
An income statement has three parts: revenue, expenses, and profit (or loss).
Revenue
The revenue section (sometimes called “the top line”) reflects the money you generate from regular business operations and activities, like sales.
Revenue is necessary to pay your employees’ salaries or wages, rent, utility bills, equipment, and anything else your business requires for daily operations.
Expenses
The expenses section includes your business’ costs to continue operating and to generate revenue. It includes employee wages, utility payments, materials costs, rent or mortgage payments, debt or restructuring expenses, and office supplies and equipment.
Profit
The profit section (sometimes referred to as “the bottom line” or “net income”) shows how much your company has left over after netting revenue against expenses. A positive number in this section means you’re in good shape because your costs don’t exceed your income. A negative number means your expenses exceed your revenues. This isn’t unusual in early-stage startups, but running at a loss for too long can lead to running out of money and business failure.
Viewing an income statement in action
To get a better idea of how an income statement works, let’s break down the basic calculations by looking at an example.

Typically, your accounting software generates an income statement for you. Still, it’s helpful to know where these numbers come from, so here’s a quick overview of how you’d prepare an income statement manually:
- Calculate gross profit. You calculate the gross profit by subtracting the cost of goods sold from net sales.
- Calculate operating income. Next, subtract your general expenses from your gross profit to find your operating income.
- Calculate earnings before tax (EBT). To find your income before income taxes, also known as earnings before tax, subtract interest expenses and any losses incurred from selling an asset from your operating income.
- Calculate net income. Finally, to find your net income, subtract income tax expense from EBT. The result is your net income, also known as your bottom line.
The line items on the income statement example above are pretty standard. Here’s an explanation of what each item represents.
Revenue
Also called sales or net sales, revenue is the monetary value of sold goods and/or services provided to customers. It’s the money your business brings in each period. This figure helps determine the net income at the end of the period after deducting expenses.
Cost of goods sold
The cost of goods sold (COGS) is the expenses incurred to produce and deliver the goods and services provided to customers. For example, costs may include what you pay to ship raw materials to a factory, manufacture the product, and then package that product.
COGS can also include direct labor expenses. However, it doesn’t include salaries and wages for employees not involved in the production process, such as administrative or marketing staff—those labor costs are included in your general operational expenses.
Gross income
Gross income creates a break in the statement and considers the business’ earnings after subtracting COGS expenses from revenue.
This figure serves as a helpful window into a company’s financial performance because it shows how much you earn once you account for production costs.
Basically, you want a positive gross income to ensure that the cost of goods is not more than the income generated from selling those goods.
General expenses
General expenses may include operational business costs like rent, salary, utilities, supplies, and non-operational costs such as marketing campaigns, debt payments, and equipment maintenance and repairs.
Interest expense
If you are currently borrowing money, you need to consider your interest expenses. Many larger companies have interest expenses for bonds, loans, credit, or debt financing.
Interest costs can eat up a significant chunk of your revenue when dealing with large commercial loans and other business funding sources, so it’s essential to incorporate this to your income statement to get a clear picture of your company’s financial performance.
Earnings before tax (EBT)
Serving as another break, your earnings before tax looks at the total revenues a business receives after incurring marketing, general, and interest expenses, but before considering taxes. This section may also be called “operating income.”
Lenders, investors, and other users of financial statements like to look at EBT because it’s useful for analyzing profitability without the impact of federal, state, or local tax laws. Essentially, this figure makes companies in different states or countries comparable even though tax laws and rates vary across borders.
Income tax
Income tax is the amount you owe based on your income for the period. The rate differs depending on where your business operates.
Net income/loss
Lastly, your net net income or profits (or net loss) reflects your final income or loss after deducting all expenses and taxes. A positive number means you had income left over after paying all costs. The higher the number, the more profitable your business can be in the long run.
You calculate your net profit margin by dividing your net income (profits) by your net sales (revenue) and multiplying by 100.
So, using the income statement above, the company's profit margin for 2021 looks like this:
Net profit margin = (155 / 4120) = .037 x 100 = 3.76%
How to work with a monthly, quarterly, or annual income statement template
Even if you have accounting software, you still need to know how to create an income statement. By doing so, you can familiarize yourself with the ins and outs of this essential financial statement—plus, you can quickly analyze the numbers when you know how to use them.
Step #1: Begin with a reporting period
Most accounting teams create an income statement monthly, quarterly, or annually. Annual income reports are essential for comparing revenue and expenses from year to year, but you should generate an income statement more than once a year.
Creating one every month gives you a much more in-depth look at your business’s finances, which allows for more hands-on management and a better chance to spot trends, risks, and opportunities. However, this can be time-consuming for your accounting team.
For small businesses, quarterly is a happy medium. But if you’re a publicly traded company, you must issue an income statement every quarter to send to the U.S. Securities and Exchange Commission (SEC).
Step #2: Generate a trial balance report
You need to get your numbers from somewhere, and this is where a trial balance report comes in handy. This bookkeeping worksheet shows a simple bird’s-eye view of each ledger account. It includes your closing balances, which you can directly input into your income statement.
You can create one manually, but using accounting software saves a lot of time by calculating the numbers for you.
Step #3: Calculate your total revenue
Remember that your total revenue is the amount of money your business made before any expenses or deductions. The formula for finding your total revenue is:
Step #4: Calculate the cost of goods/services
Your cost of goods is how much it costs to maintain a product or service. COGS could include raw materials, direct labor, shipping and inventory storage costs. The formula for calculating your cost of goods is:
Step #5: Calculate gross profit
Your gross profit is how much revenue is left over after you’ve subtracted the cost to buy or produce and maintain your inventory or services. The formula for calculating gross profit is:
Step #6: Calculate operating expenses
Make a list of all your everyday expenses other than COGS. Operating expenses might include salary, rent, utilities, supplies, and other essential costs of your business’s day-to-day operations.
Step #7: Calculate interest expense
If you have any outstanding loans, bonds, or other debts, consider the interest on all these liabilities. Use this formula for each of your liabilities and then add the total interest expenses together:
Step #8: Calculate income tax expense
Your tax liability is based on your taxable income multiplied by your effective tax rate. However, there may be differences between the net income shown on your income statement and your taxable income. These differences can stem from:
- Non-deductible expenses like political contributions, fines and penalties, and entertainment expenses
- Tax credits like the Work Opportunity Tax Credit or the Small Business Health Care Tax Credit
Work with a tax advisor to calculate the tax you owe for the year.
Step #9: Calculate net income
Finally, you’ll calculate your net income (or net profit) with this formula:
Analyzing your income statement
Although income statements show a lot of helpful information, it can be hard to understand and digest all of the financial data at once—which is why many business owners and accountants take time to analyze them and assess how the numbers reflect actual performance.
There are two main financial analysis methods: vertical and horizontal analysis. Using both can help highlight some data you might have overlooked and allow you to visualize the information in a way that’s easier to understand.
Method #1: Vertical analysis
Vertical analysis aims to simplify your income statement. It’s hard to keep track of actual dollar and cents values, so vertical analysis makes it easier to understand the information by presenting each line item as a part of the total percentage of your company’s sales:

Take a look at the example above. You can see that the net sales always start with 100%. Every other line on the income statement is expressed as a percentage of sales. So, deducting COGS, which in this case accounts for 25% of revenue in Year 1, leaves a gross profit of 75%.
Then, you deduct expenses from gross profit. Expenses account for 42% of revenue in Year 1, leaving the company with 33% of revenue left over in the form of total net income.
Method #2: Horizontal analysis
Horizontal analysis is a tool to compare a particular year’s revenue, expenses, and profits to previous years. Comparing years helps you see what differences and changes occurred.

Look at this example for Village Shipping Inc., which compares income statements between 2020 and 2021. On the far right, you can see a list of percentage changes from 202 to 2021.
There are negative changes almost all the way down. This analysis ultimately tells the Village Shipping Inc. company that they did not make as many sales as the year before. Fortunately, total expenses also dropped, so the company was still able to turn a profit.
You can see in the analysis that the negative changes are fewer sales and several expense increases, such as repairs, rent, and office expense increases.
Keep track of all of your income statements in one place with the right tools
An income statement is one of the three essential financial statements every business owner should know.
But it’s also vital to track and keep your income statements organized because having a proper record of past results is:
- Essential to forecasting market trends
- Required by creditors, lenders, and investors
- Helpful when analyzing financial data, like revenue drops or expense increases

