In Q1 of 2026, BILL collaborated with Treasury Webinars to conduct an original survey—AR and cash application challenges: benchmarks, collaboration, Technology. The study explores the cost of processing various incoming payment types (check, ACH, card payments), the level of control companies have over the payment types they receive, and the economics of each one.
We’re excited to share some early findings, which are also discussed in our recent webinar, available now on-demand.
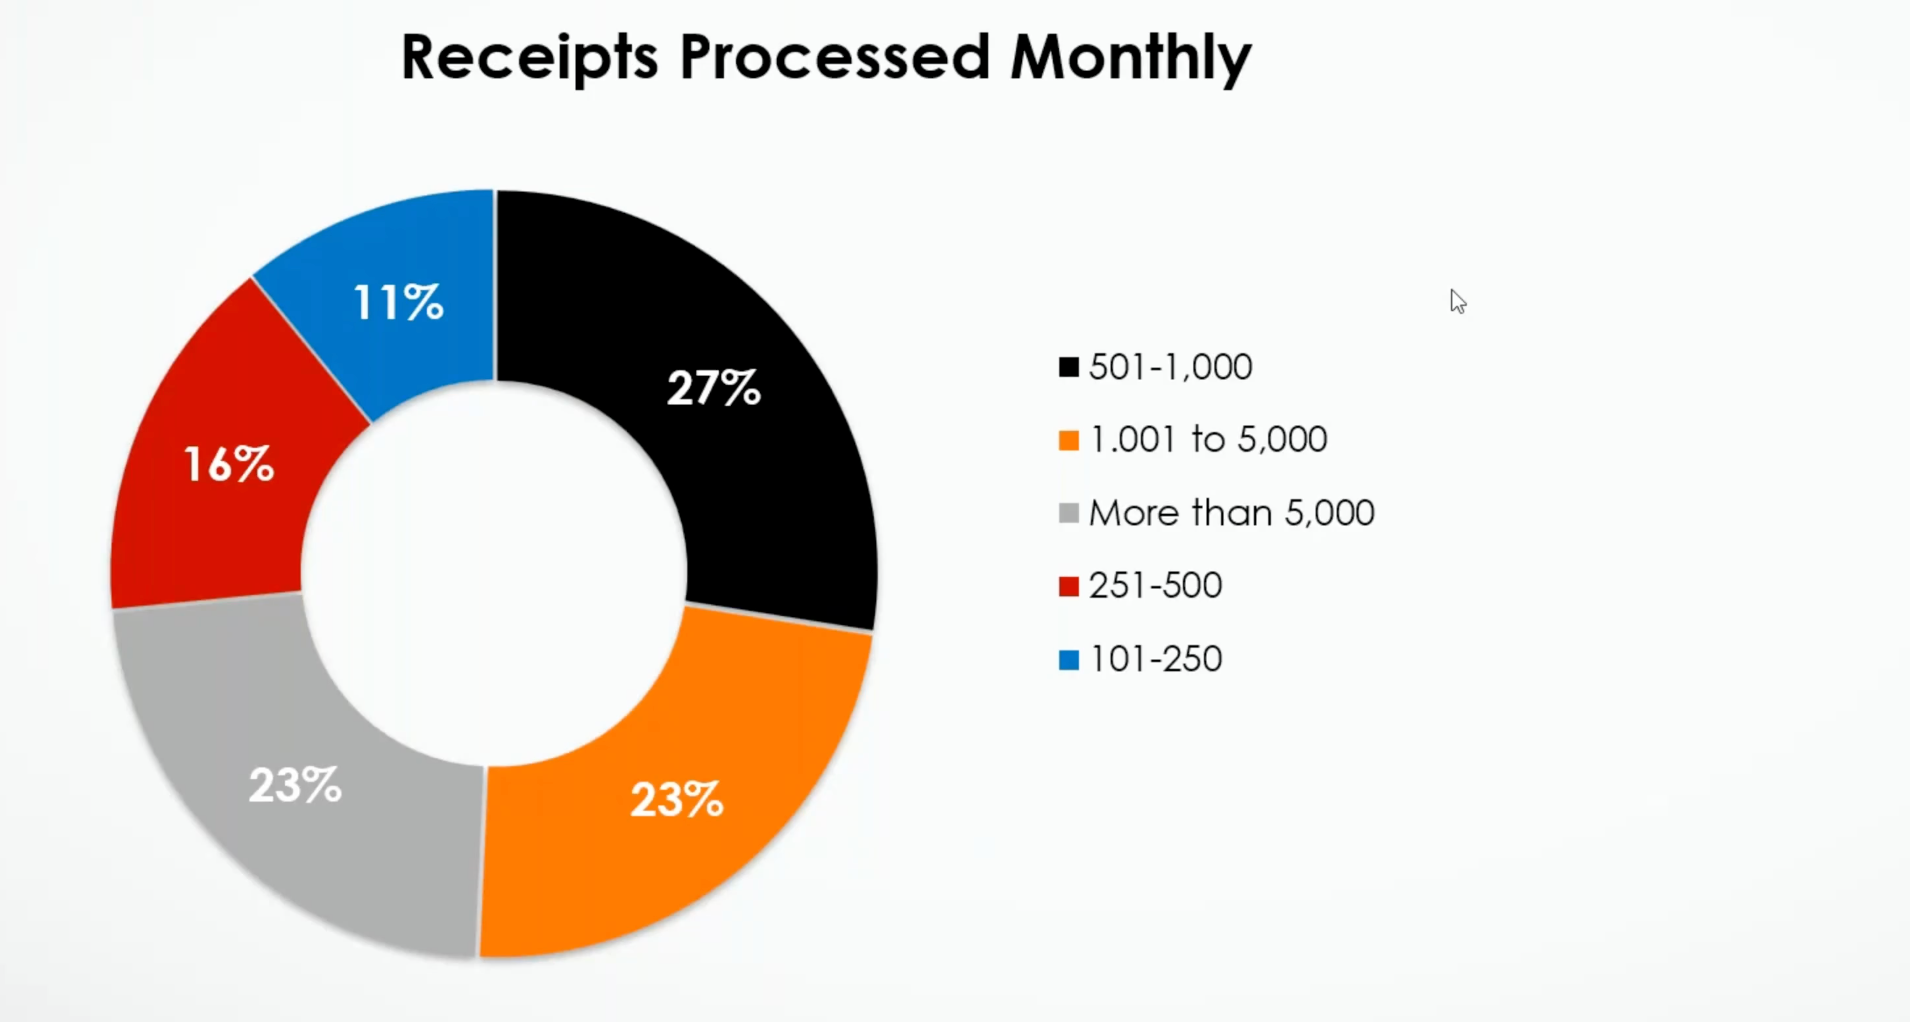
To make sure the companies surveyed were handling significant AR volume, the pool was set at a minimum of 100 incoming invoices per month. Here's the final distribution:
- 101-250: 11%
- 251-500: 16%
- 501-1,000: 27%
- 1,001-5,000: 23%
- More than 5,000: 23%
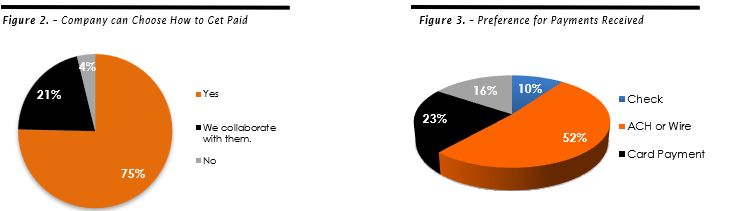
Our analysis of customer payment economics begins with an overview of payment methods accepted by the surveyed companies. Of these companies, thirty-five percent reported receiving more than one-quarter of their incoming payments via check.
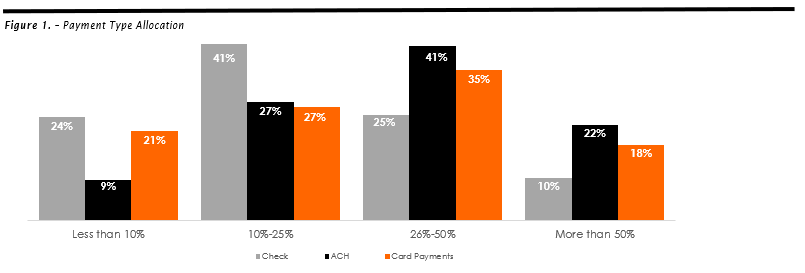
However, this isn't their preference. Only 10% of the companies surveyed said they preferred to receive checks, and only 4% said they were unable to choose how to get paid. In fact, a clear majority (75%) said they can choose how to get paid, and another 21% said they could collaborate with their customers or clients on that decision.
With a clear preference against checks, why are so many companies still accepting them?
Some of that choice may come down to the desire to offer multiple payment types. We asked our survey respondents about the impetus behind offering multiple options, letting our participants choose as many reasons as they wanted, and found a relatively wide range of responses:
- Customers request them — 48%
- Different sized companies need various options — 48%
- The footprint of our customers is global — 23%
- We offer all current and emerging options (i.e. Bitcoin) — 15%
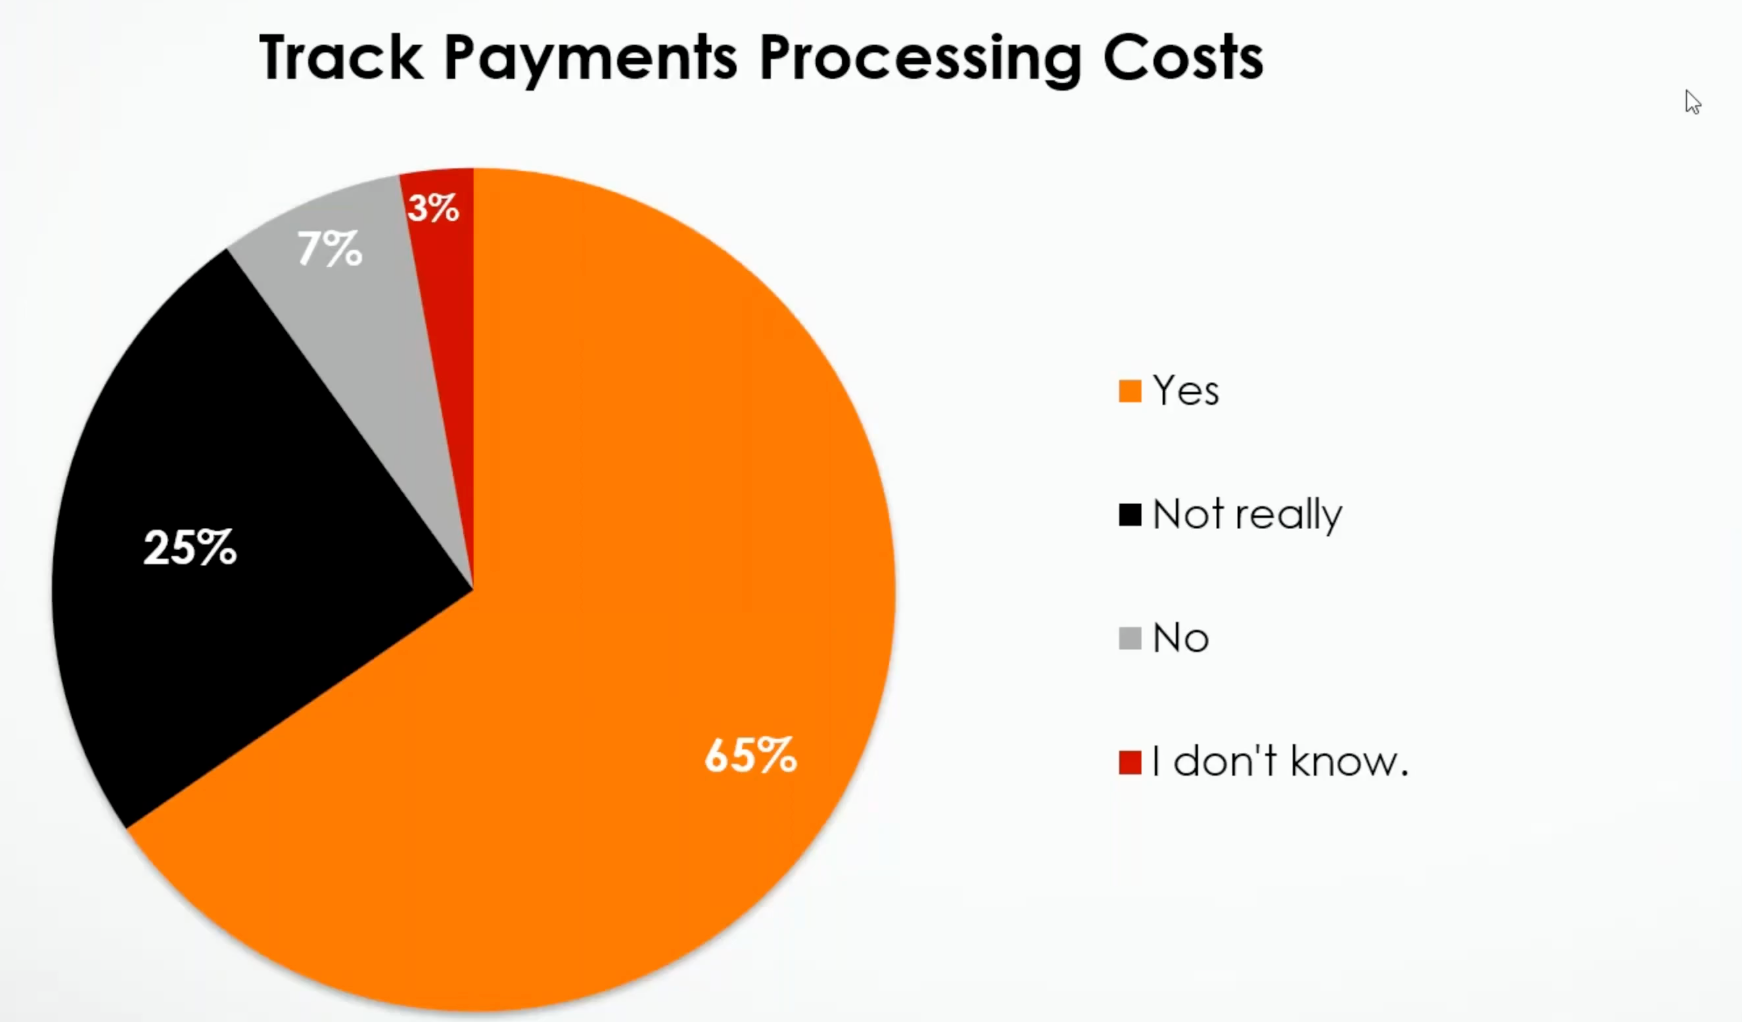
And yet, only 65% of respondents said they track the cost of processing those AR payments. The vast difference in speed and convenience between checks and other payment methods would suggest that many companies may be incurring more costs for accepting checks than they realize.
So, what are those costs? Here's how companies report the difference between the cost of processing a check and the cost of processing ACH payments:
- More than $5.00 difference — 10%
- $3.01 - $5.00 — 14%
- $2.01 - $3.00 — 22%
- $1.01 - $2.00 — 19%
- $0.51 - $1.00 — 15%
- $0.00 - $0.50 — 12%
- Don't know — 8%
Respondent companies also reported several cash application challenges:
- Deductions, disputes, and exceptions — 58%
- Missing remittance information — 55%
- Cash is unapplied for too long — 46%
- General lockbox issues — 38%
- Not enough staff to dedicate to cash application — 28%
In addition, 72% of companies agreed or strongly agreed that they see recurring cash application issues with the same customers.
Companies often apply lockboxes to overcome cash application issues, but of our respondents, the majority (59%) agreed or strongly agreed that a lockbox would not be needed if cash application was more efficient. Only 13% of companies disagreed.
Given the clear advantages of removing checks from the mix, we asked our respondents about the biggest impact of better technology when it comes to cash application. Here's what they said:
- Missing remittance information — 20%
- Deductions, disputes, and exceptions — 33%
- Cash is unapplied for too long — 30%
- Not enough staff to dedicate to cash application — 16%
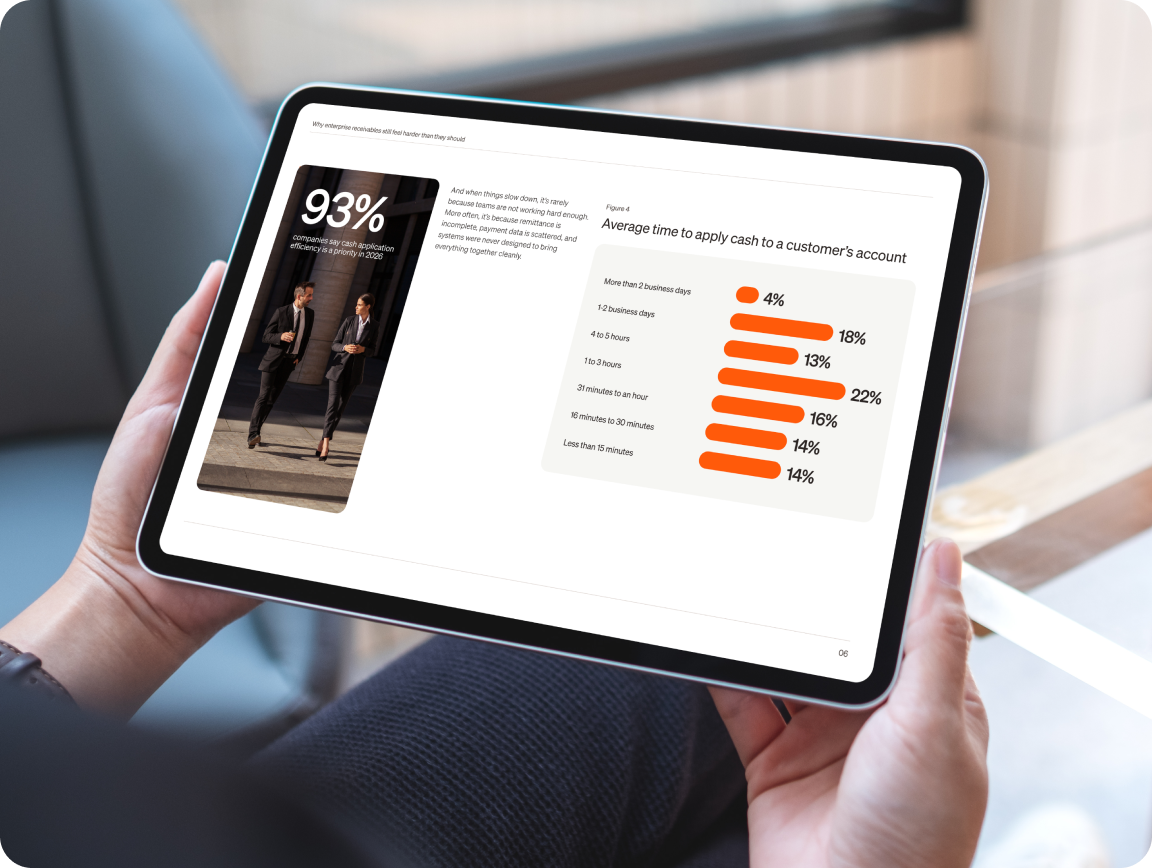
Fortunately, teams are paying more attention to the effect that cash application can have on their entire systems, with 93% of respondents saying they were making cash application efficiency a priority in 2026—and 96% of respondents reporting at least some ability to choose how they get paid.
For a complete walkthrough of the survey results along with concrete tips for improving cash application efficiency, check out our recent webinar, available now on-demand.
To explore the benefits of a modern AR solution, see how BILL for Suppliers offers a lightweight way to automate incoming payments and cash application.
Appendix:
The AR & cash application survey: Five key themes and implications
Cash application nightmares have only gotten worse for companies despite all of the advances in AI and related technology. Why is cash application still so difficult? What factors drive cash application issues and inefficiencies? What can companies do to mitigate cash application headaches? Do opportunities exist for companies to improve cash application efficiency while lowering DSO and improving customer relationships? In Q1 of 2026, Bill, in collaboration with Treasury Webinars, conducted the original survey: AR & Cash Application Challenges: Benchmarks, Collaboration, to explore these issues.
An analysis of the survey results yielded several key themes and inferences that can help companies deliver more value from their AR, treasury and finance teams. The inferences and key results that drive five of these inferences are:
- Companies track and experience meaningful differences in processing payment types, and checks are the most expensive type of payment to process.
- 65% of companies see at least a $1.00 difference in processing a check vs. and ACH payment, and 24% see at least a $3.00 difference.
- 65% of companies see at least a $1.00 difference in processing a check vs. a card payment, and 25% see at least a $3.00 difference.
- 65% of companies see at least a $1.00 difference in processing an ACH vs. a card payment, and 17% see at least a $3.00 difference.
- Checks are still prevalent even though companies can choose how they get paid
- Thirty-five percent of companies, which each process at least 100 invoices a month, receive more than 25% of incoming payments via check.
- Twenty-two percent of companies receive more than 50% of incoming payments via check.
- Over seventy-five percent of companies receive at least 10% of incoming payments via check.
- Cash application matters
- Ninety-three percent of the 211 companies surveyed are making cash application efficiency a priority in 2026.
- Cumbersome cash application processes were consistently identified as one of the top three factors with the most significant negative impact on AR performance.
- Deductions, disputes, and exceptions represent the greatest challenge to cash application efficiency and the area with the most potential improvement through the right technology.
- Fifty-eight percent of companies identified deductions, disputes, and exceptions as a cash application challenge.
- Companies identified the area of greatest impact with better technology related to cash application most often as deductions, disputes, and exceptions (33%).
- Improved cash application efficiency can remove the need for lockbox services
- Only 13% of companies disagreed that the need for lockbox services would go away if cash application was more efficient.
- Companies identified the deduction, disputes and exceptions (58%), missing remittance information (55%) and cash unapplied too long (46%) as the cash application issues most frequently experienced. The cash application issues that would be most effectively addressed through improved technology were deductions, disputes, and resolutions (33%), followed by unapplied cash aging too long (30%) and missing remittance information (20%).